Public key is the key you give to the public so they can encrypt information to be given to you.
Private key is the key you use to decrypt the information.
Get the users that have been accessing your server:
sudo cat /var/log/nginx/access.log | grep [SOME_USER_NAME]Dashboard Update
Sketch Mode
1. real-time sensor data changes reflected on the UI
2. playback the sensor data history
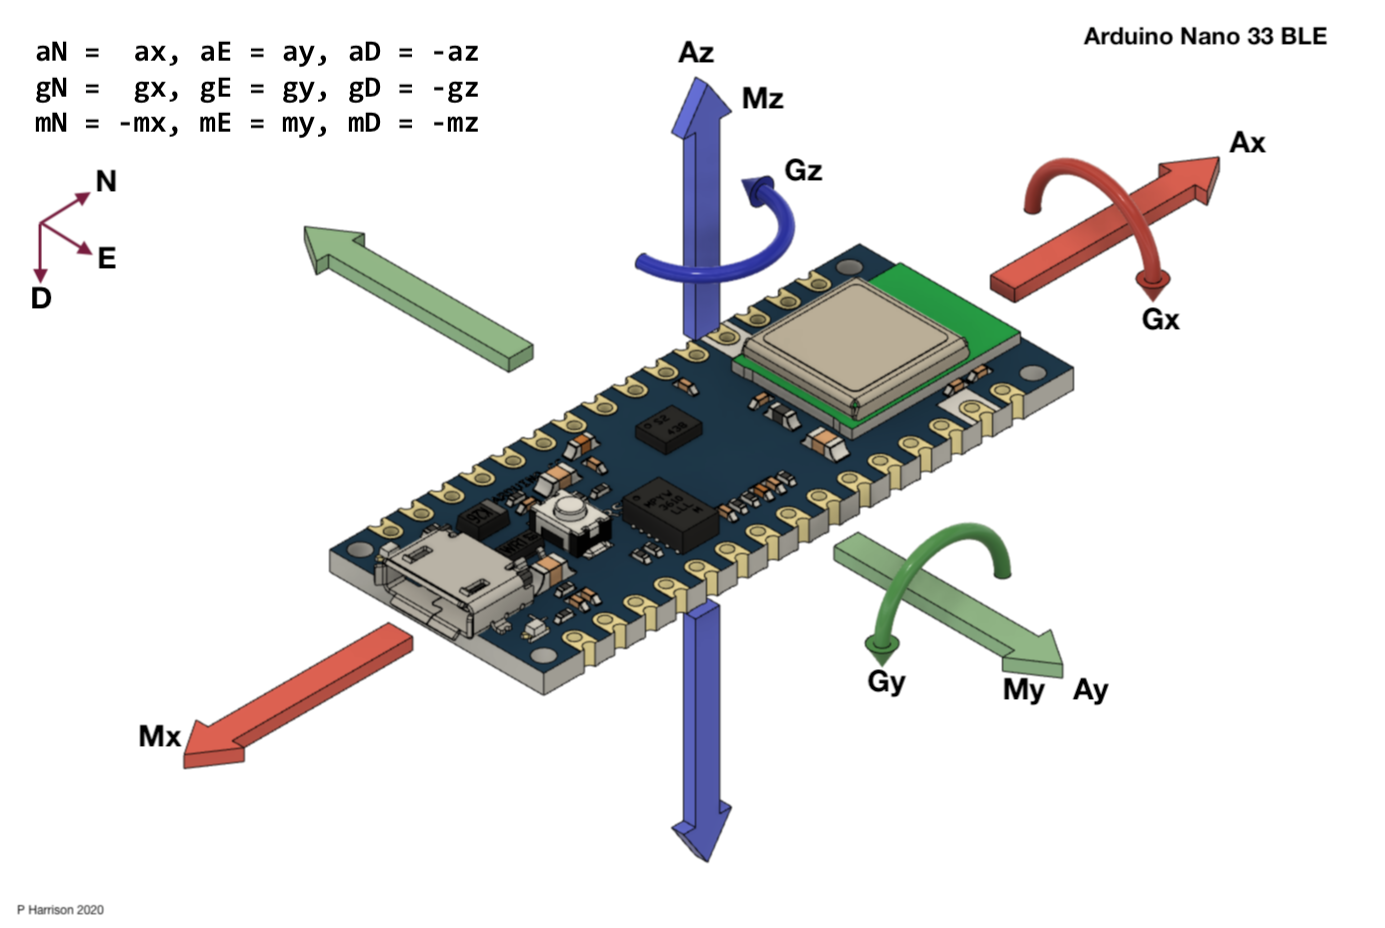
3. conventional graph log for gx, gy, gz, ax, ay, az, and heading (magnetometer)
4. possible exploration on drawing (... i couldn't get the light to work nicely because i don't have a magnetometer (yet), the drawing one is not looking good either, but it was a bit better than the light as i feel like it is easier to understand direction & the drawing velocity of line than the rotation angle of the plane under the light)
Some architecture of the dashboard that I tried:
1. I removed the log.json and use a websocket (io) server for real-time update purposes, no data is stored in client
Arduino -> TCP network -> emit broadcast to all clients (dashboard)
2. added express server to provide /sensor-data so that client can fetch all the available sensor data that they might have missed if they close the tab
Problem for the future:
1. need to host this on a public server so i don't need to turn on and off my local server -> done on Render, but for now i'm still using local
2. what if there are multiple users? should i create a database of users and start saving their data into a storage? and subsequently they need to be authenticated to see their data? what kind of authentication would i want? should it be a game? who is moving more? or maybe just a little movie?
Issues:
1. Arduino code always freezes when arduino is being tilted on the x or y axis. Suspect is the magnetometer integration that causes I2C bus hang-ups. If I rotate the Arduino on the yaw (z), it seems to work fine. It is only if i rotate / tilt it on x or y axis that it stops sending sensor to the Serial Monitor.
Answer in class (thanks Tom & everyone!): the 6 DoF & compass may be running on different intervals.
2. If I want to use the device as if it is a pencil writing on air (arduino pointing forward towards the X axis), movement on X on canvas will be movement on X axis on Arduino, and movement on Y on canvas will be movement on Y axis on Arduino as well. I suppose I could try to get the magnitude of the x and y delta from accelerometer. The problem is that what if I want to turn direction? Pencil doesn't rotate to change direction, user usually just drag their pencil towards the direction that they want, but does not necessarily rotate it in order to achieve it.
I haven't found a way to accurately get the rotation angle (even after processing the ax, ay, az with gx, gy, gz with magnetometer). For now, the easy way is to use the device as if it is mouse writing on a desk (pointed parallel to ground and able to rotate on z) or as a magic wand (pointed up and able to rotate on z), as we're able to easily use the magnetometer to define direction instead of relying on the accelerometer and gyroscope that will drift.
Figuring out IMU directions
Elizabeth Kezia Widjaja © 2026 🙂