Demo
Emergency link for demo: https://inviolate-subgranular-arie.ngrok-free.dev
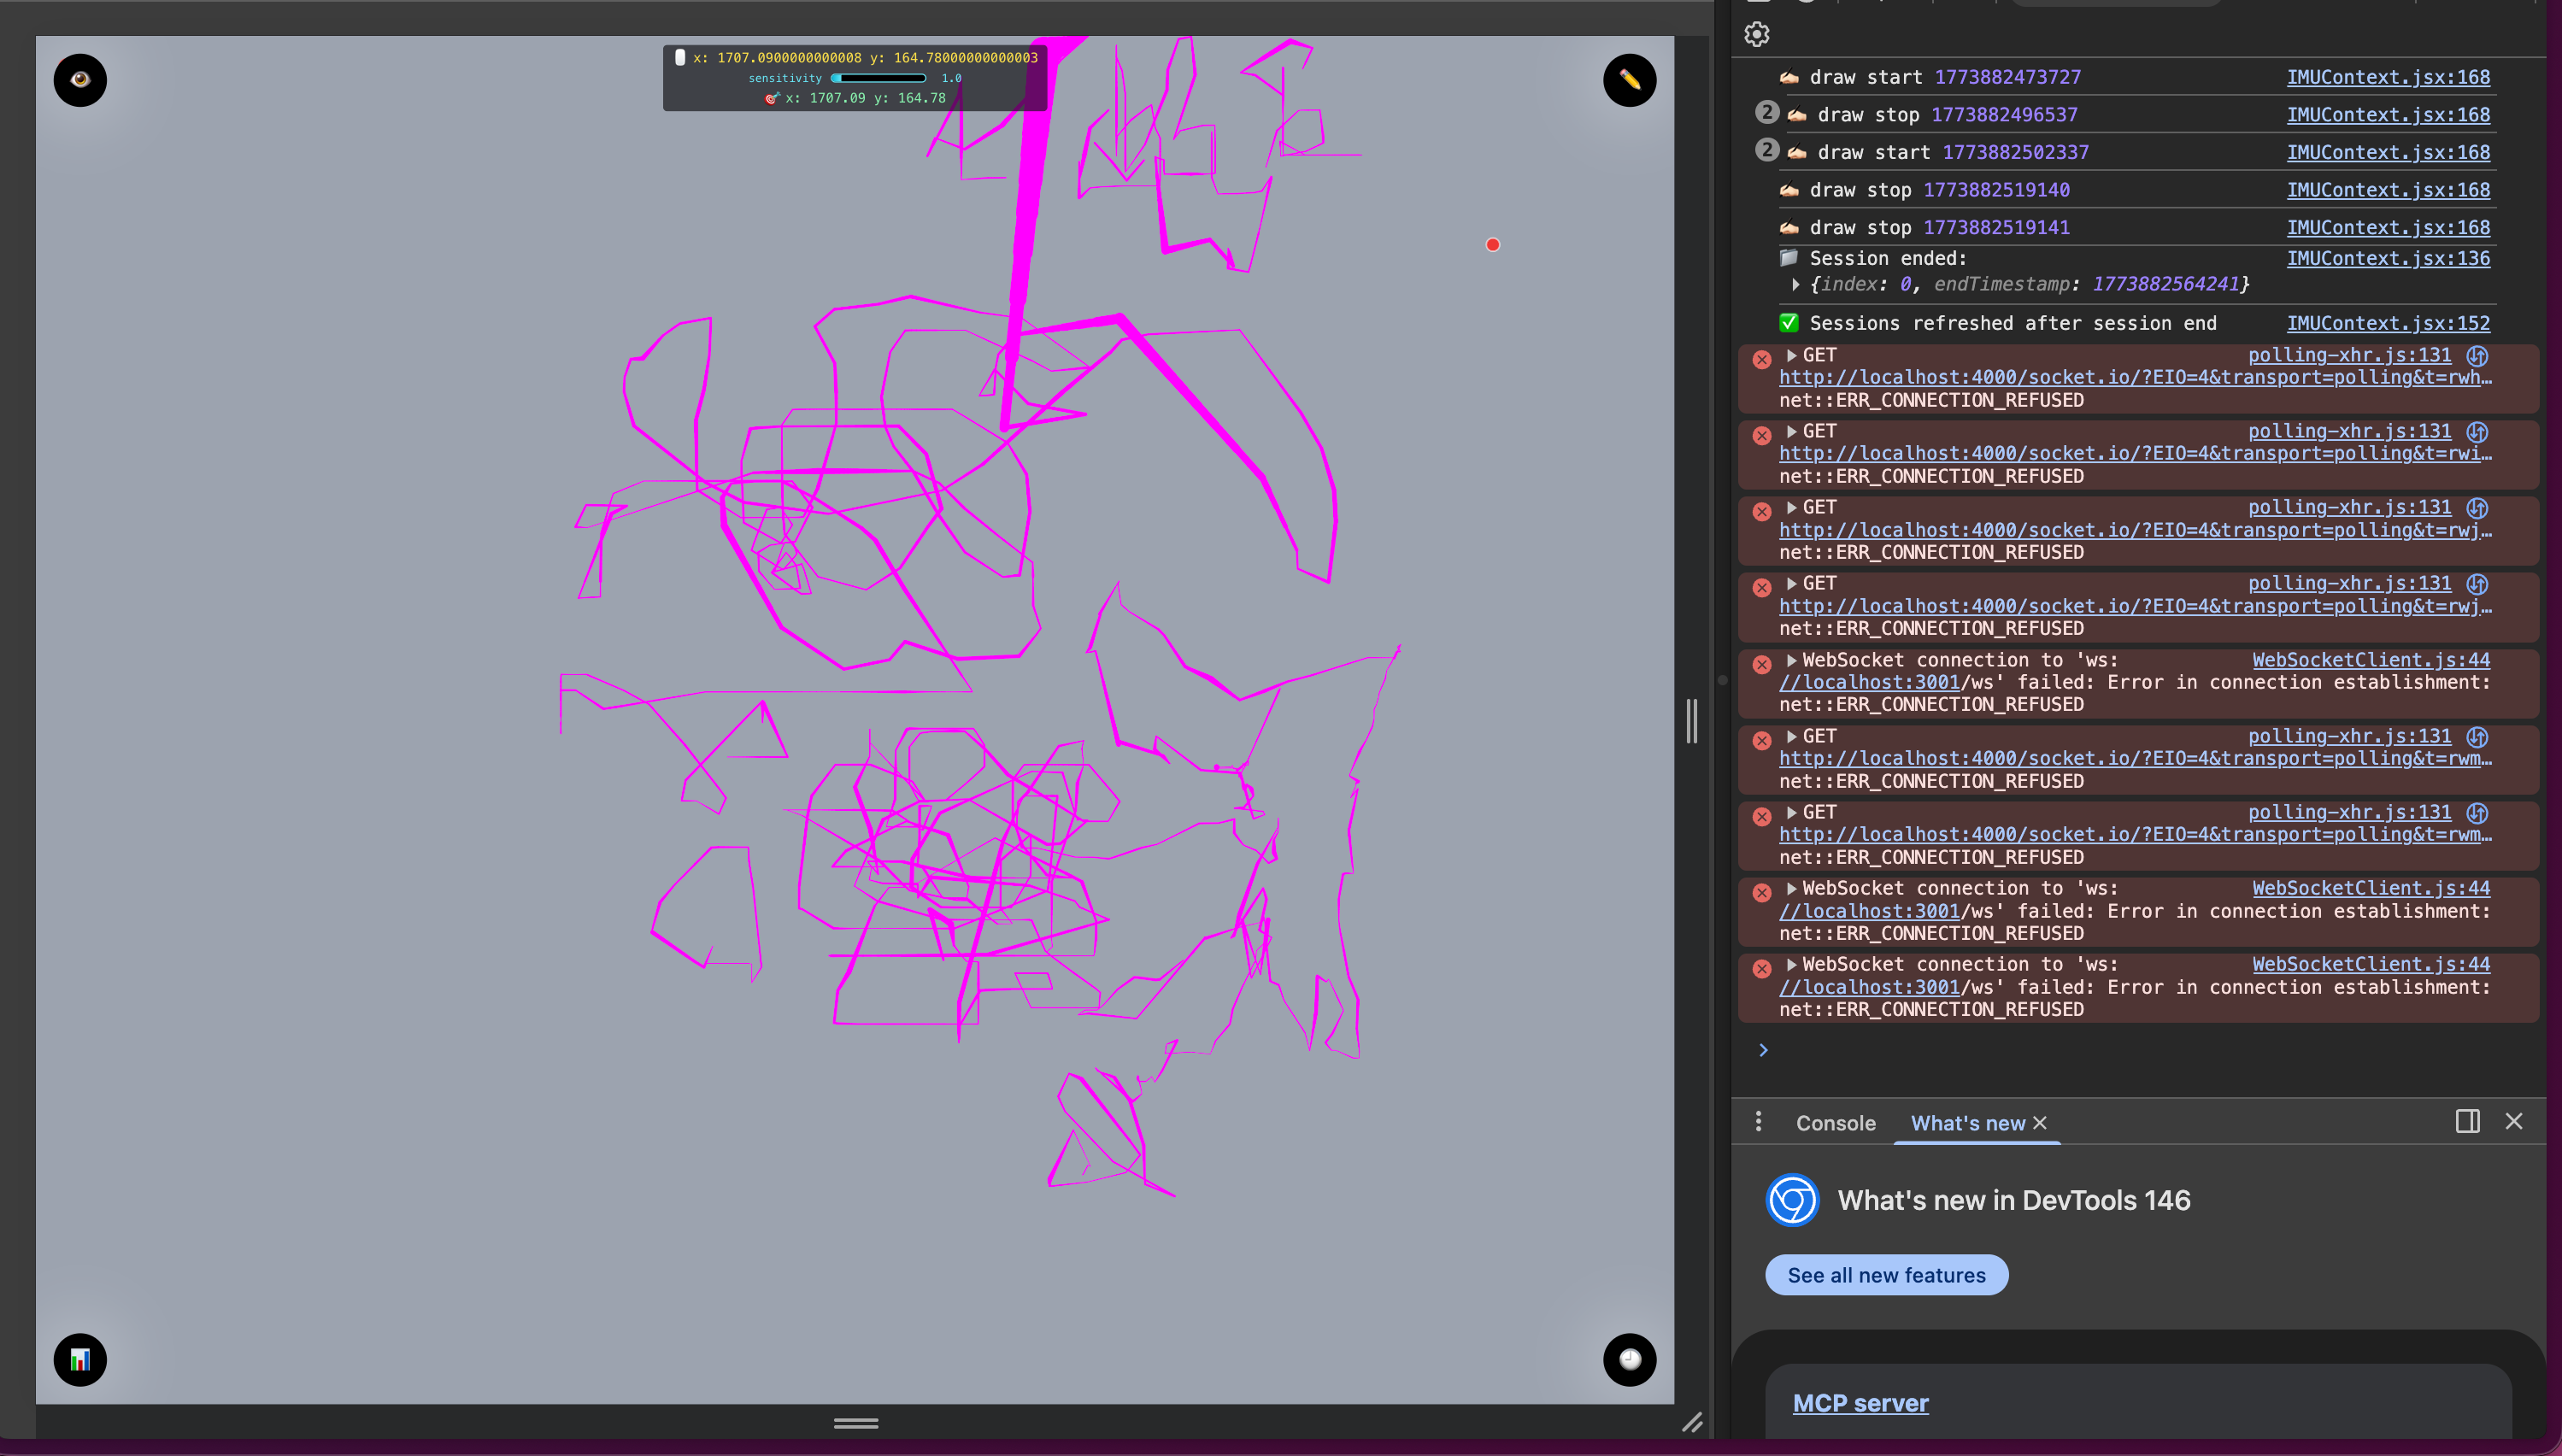
Sample illustrations of our drawing:
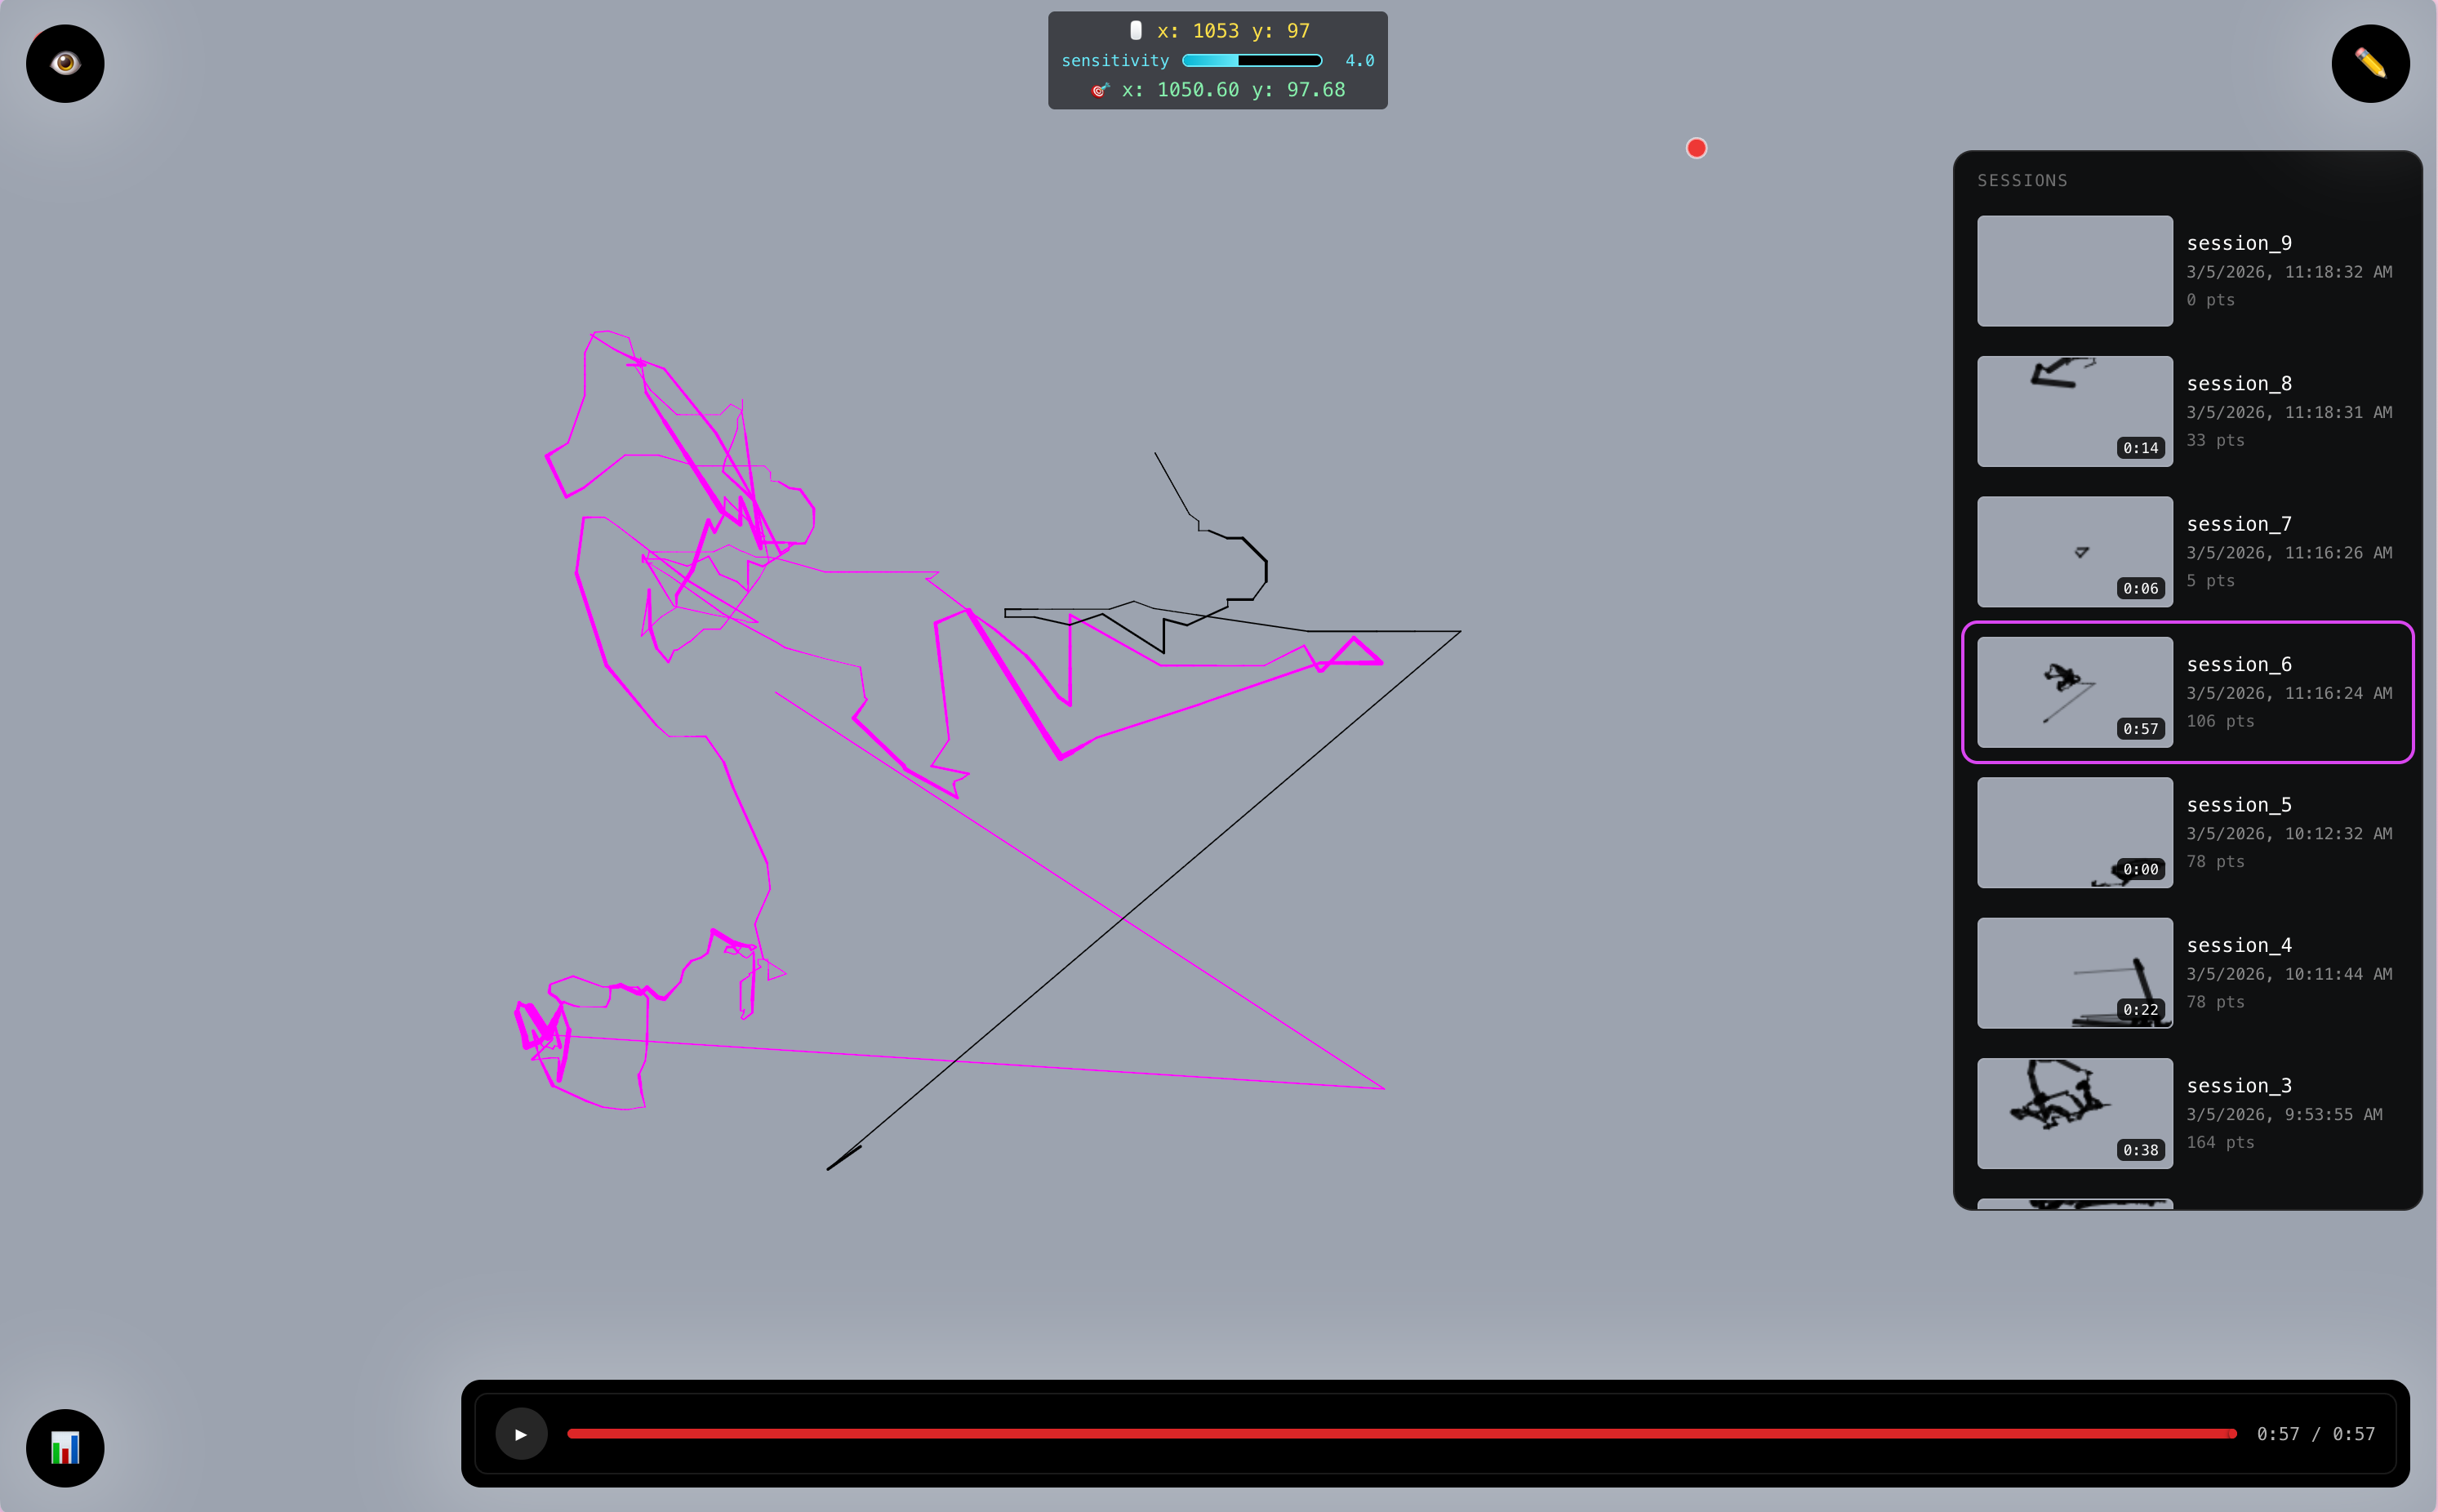
Realtime (marked by fuchsia)
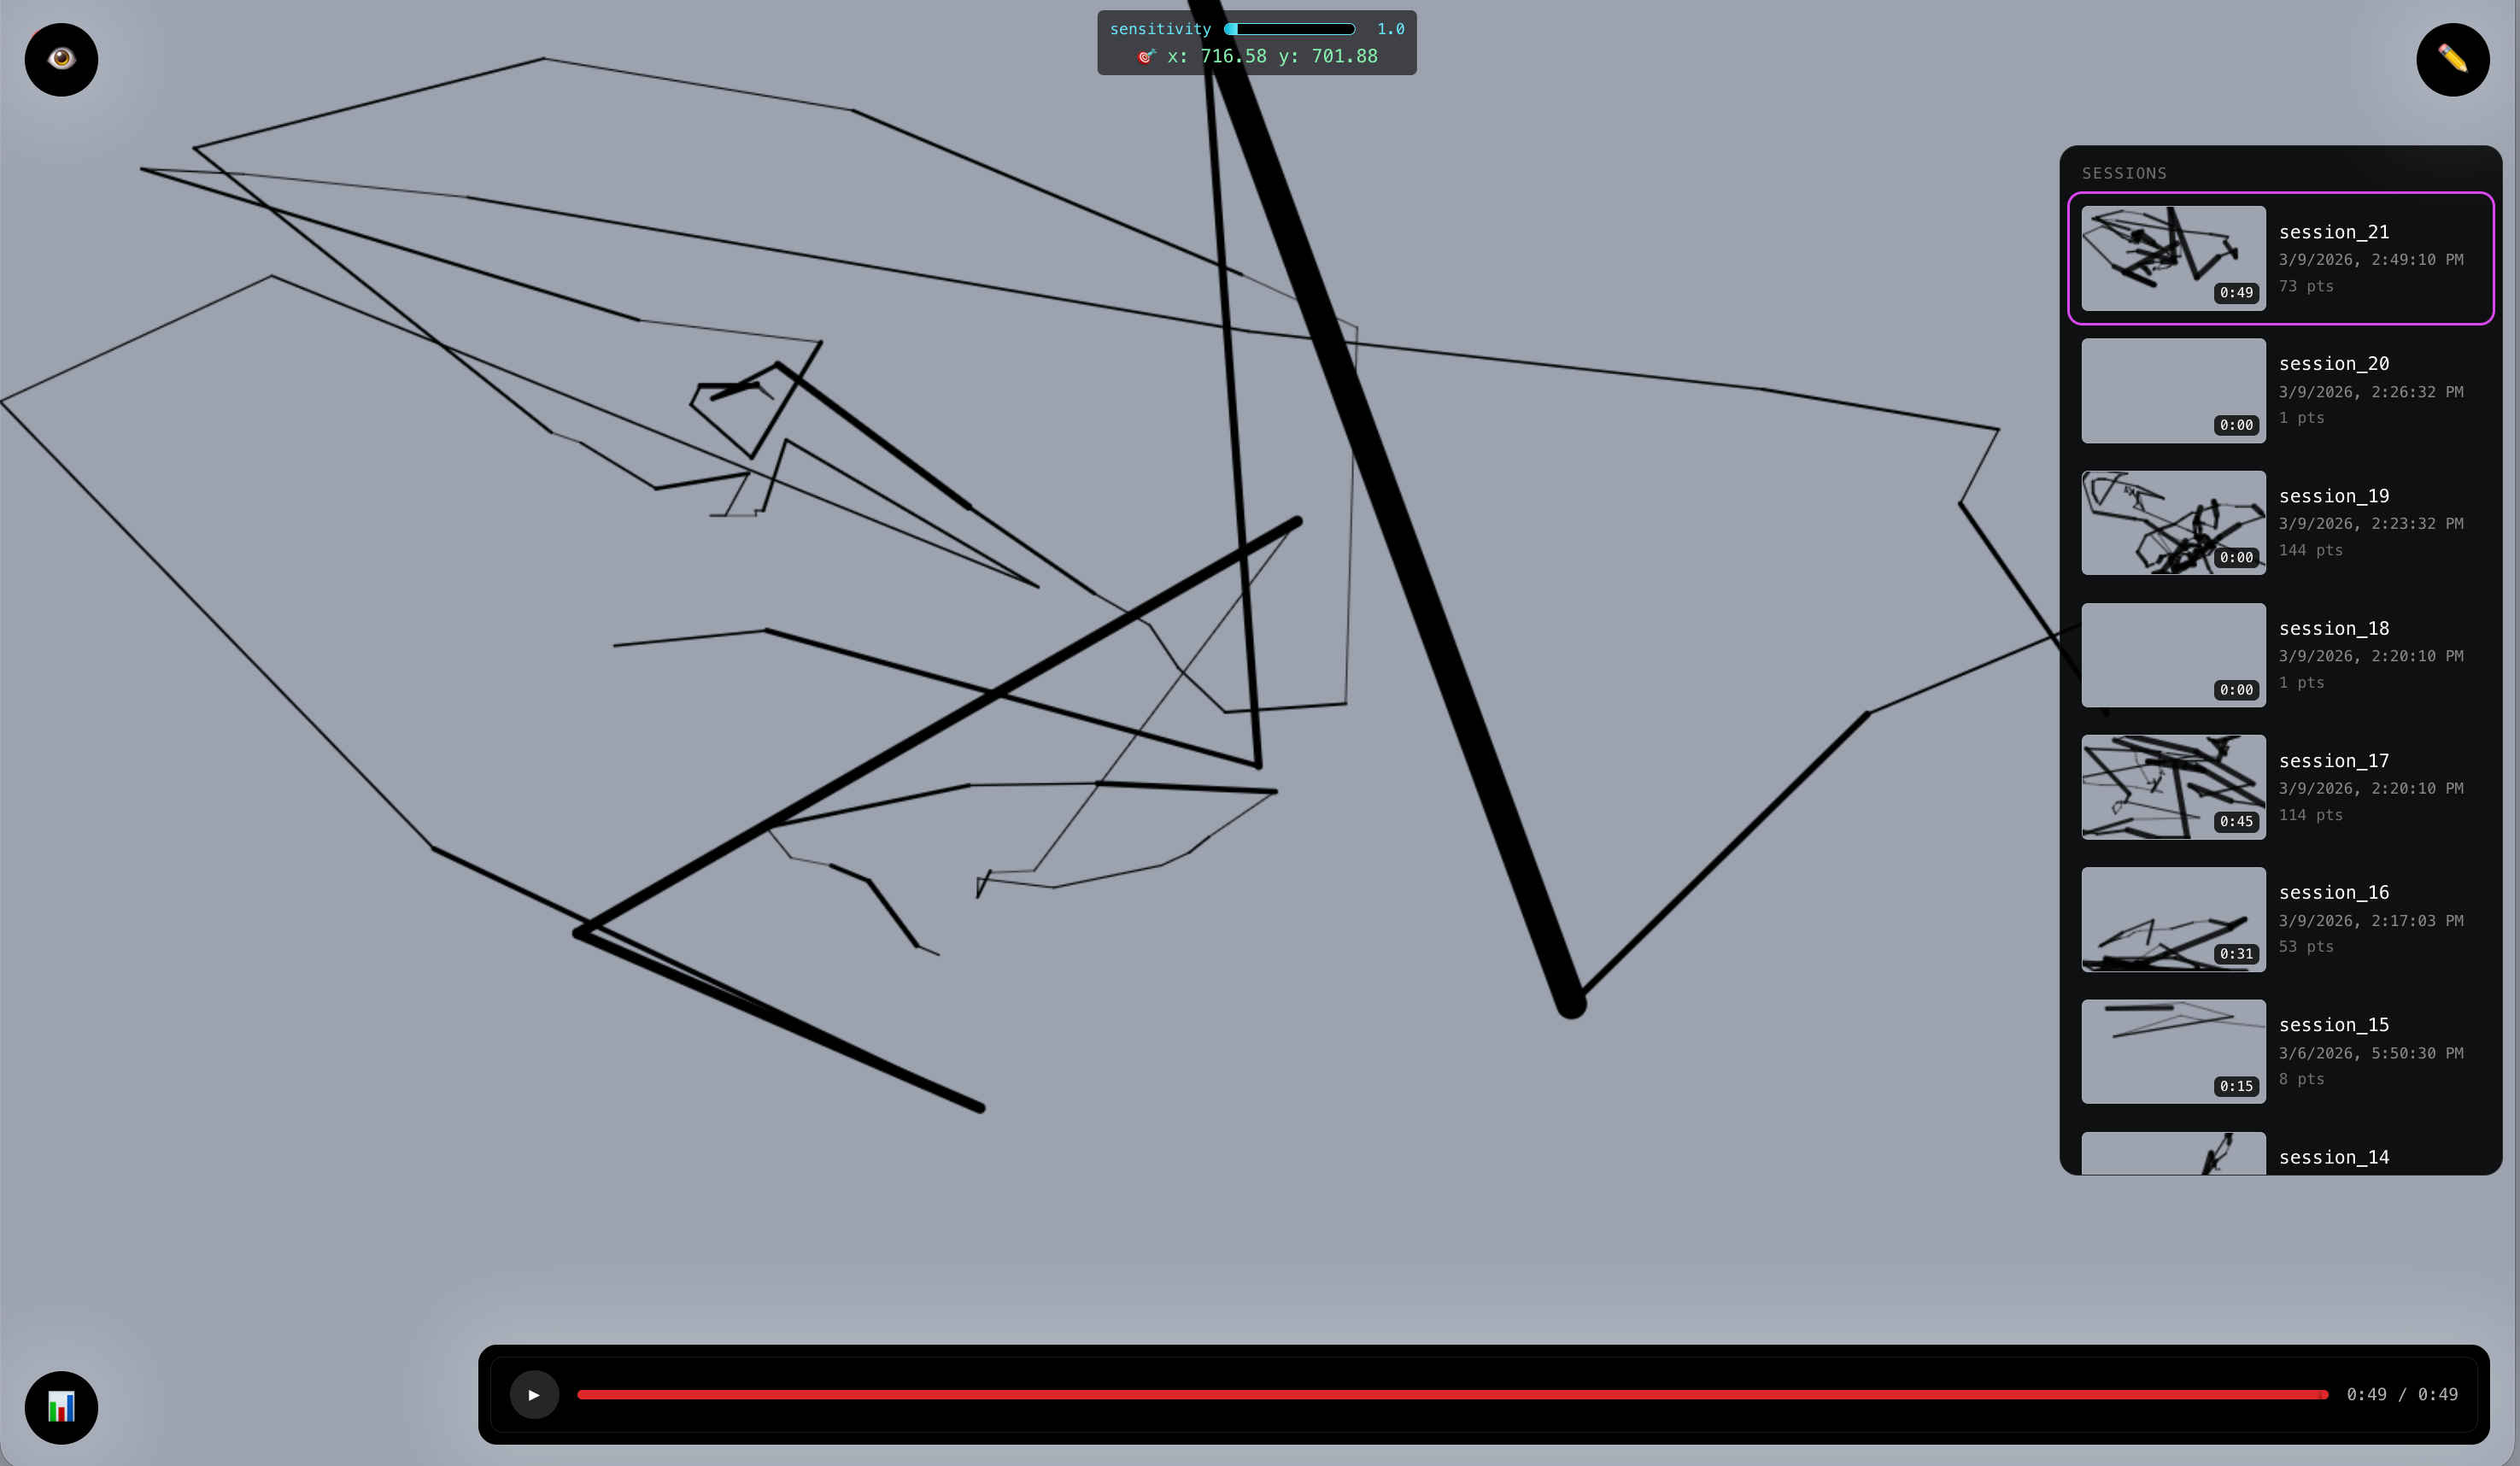
History from firebase (marked by black)
More...
System diagram:
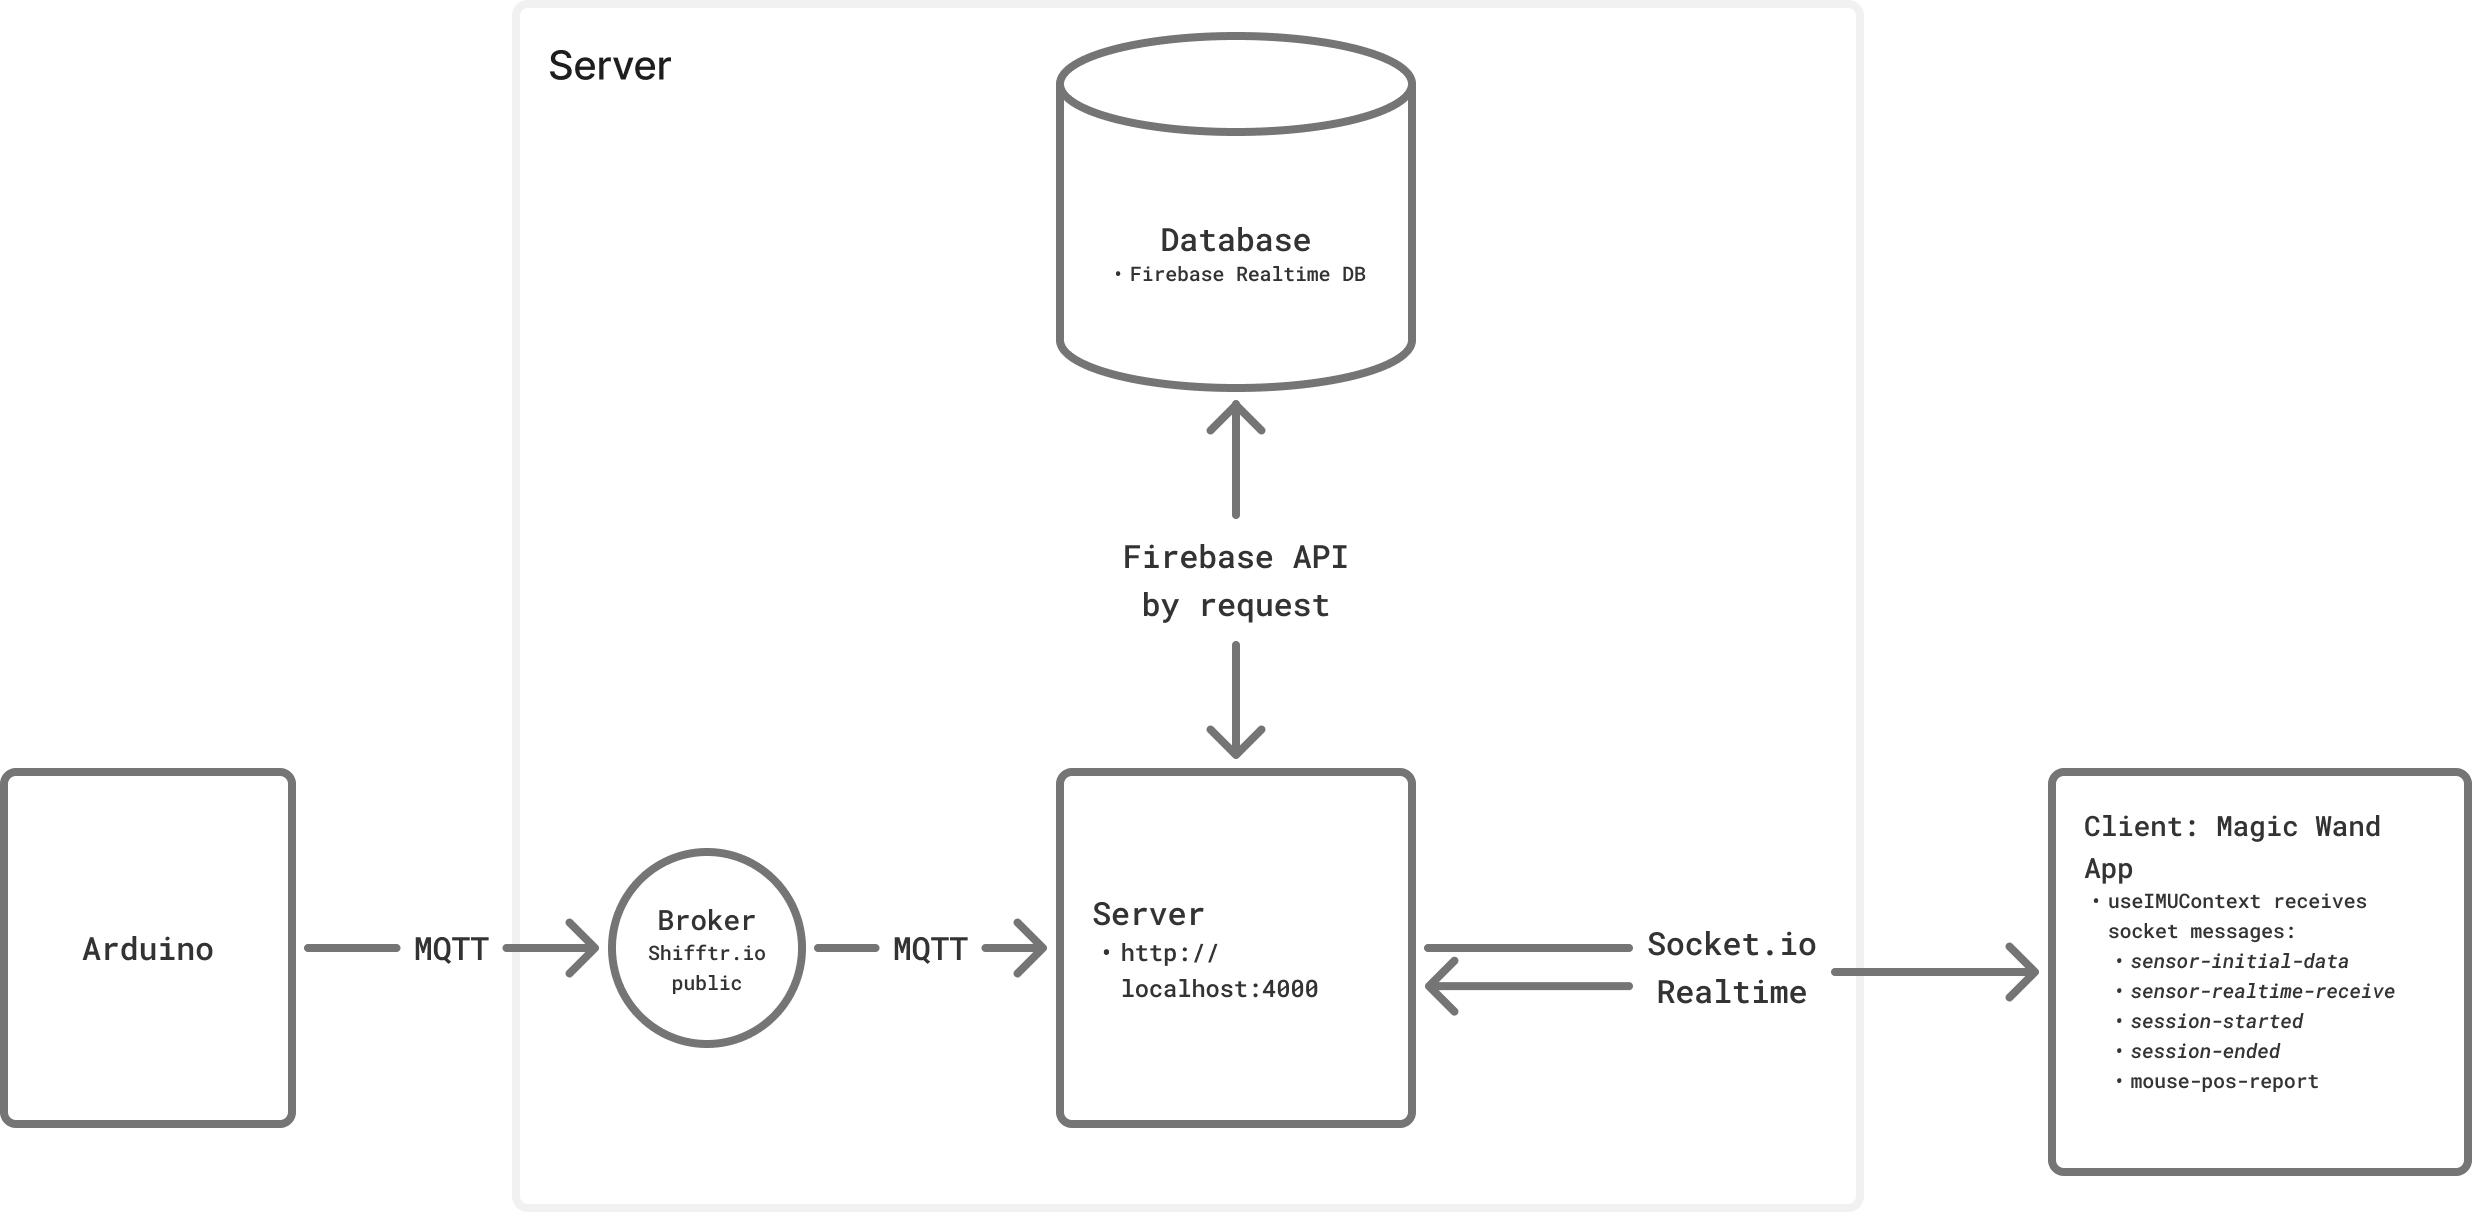
Server
In the server, we have 2 main communications that are mediated by:
1. MQTT
The MQTT in the server has several connection points:
- connect
- message
- subscribed to
kezia/imuwith subtopic:data(object): devicename, ax, ay, az, gx, gy, gz, pitch, roll, heading, sensitivity, calibrated, timestamp(although for now we're only usinggy, gz, sensitivity,andtimestampdraw(string): “start” | “stop”click(int)power(bool): true | false
- subscribed to
2. Socket.io
The socket handles the realtime connection that are marked by the topics:
sensor-initial-data: restores initial data from db (server → client)sensor-realtime-receive: receives realtime message from server (server → client)session-started: to signal client to start drawing (server → client)session-ended:to signal client to stop drawing (server → client)mouse-pos-report: reports mouse pos to server to define where to start drawing (client → server)screen-size:reports screen size to server for optional mapping
3. Processing sensor data at processSensorData(parsed, source='mqtt'):
Note that the wand is meant to be used parallel to the ground.
gz (roll) -> used for horizontal position of the cursor
gy (yaw) -> used for vertical position of the cursor
DEAD_ZONE: defines the threshold to let the cursor moves, to prevent much noise coming from slight movement.
SENSITIVITY: defines the unit that will be multiplied with the delta of the movement, similar to cursor speed. Can be controlled by the potentiometer knob.
const moveX = getAxisValue(data, WAND_CONFIG.x.axis, WAND_CONFIG.x.invert) * sensitivity;
const moveY = getAxisValue(data, WAND_CONFIG.y.axis, WAND_CONFIG.y.invert) * sensitivity;
getAxisValue() preprocesses the data according to the config and to ignore the data that is exceeding the threshold/DEAD_ZONE
then ensure the targetX and targetY is within the screen size.
targetX=Math.max(0, Math.min(targetX+moveX, screenW-1));
targetY=Math.max(0, Math.min(targetY+moveY, screenH-1));
then accumulate the displacement,
displacementnetX += moveX;
netZ+=moveY;
distX+=Math.abs(moveX);
distZ+=Math.abs(moveY);
then emit it to socket.ioio.emit('sensor-processed-mouse-pos', { x: targetX, y: targetY });
*note for dev:
use node server_relay.js
Arduino Nano 33 IoT (with built-in IMU)

diagram by Antonia
The device requires:
- Network -> WifiNina :
connectToNetwork(); - MQTT connection :
connectToBroker(); - IMU from the Nano 33 IoT :
IMU.begin(); - Haptics via Haptic Motor Controller Adafruit DRV + the buzzer ->
drv.begin()
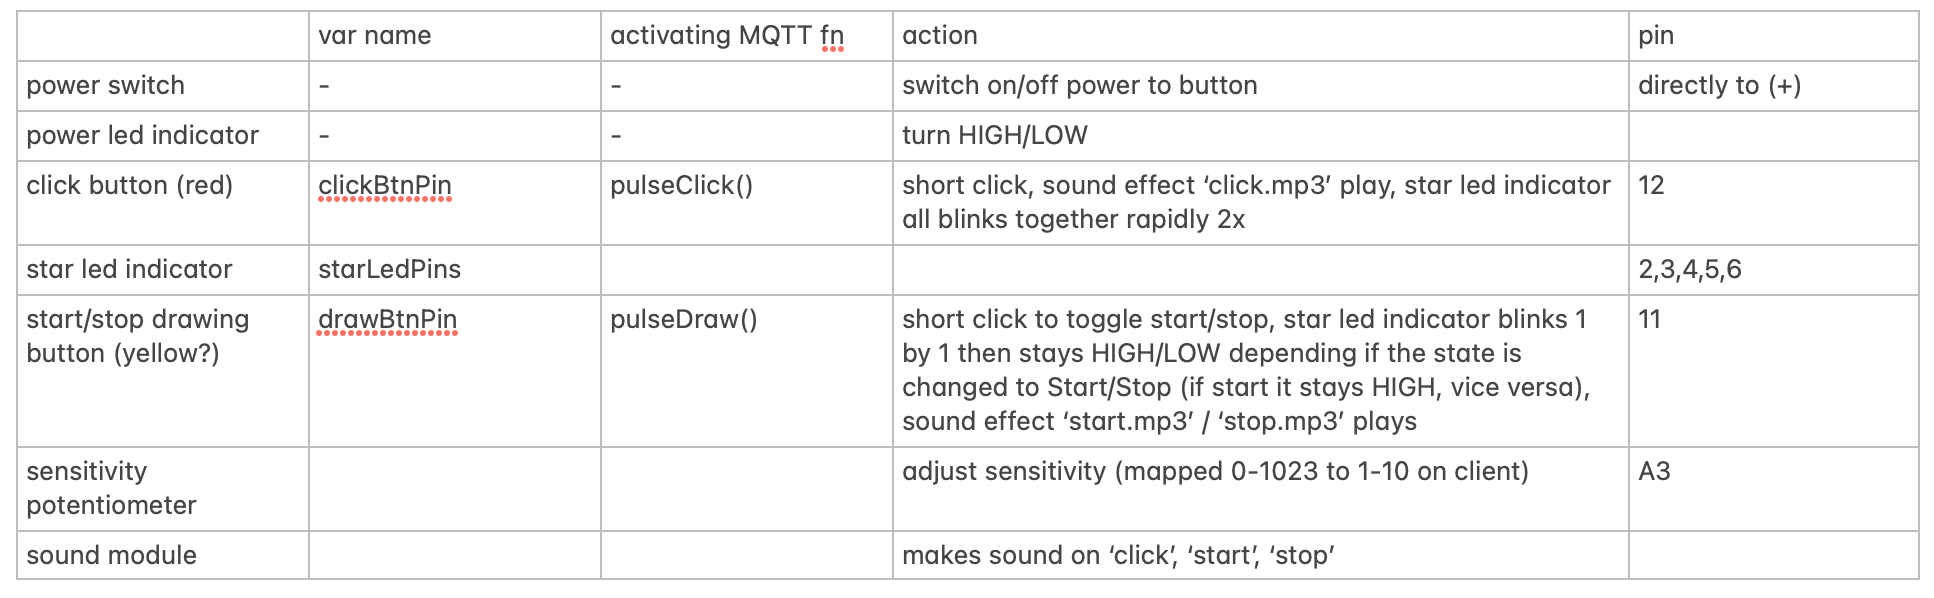
MQTT communications:
- when device is on (connected to power), it immediately publishes to
kezia/imu/power:true“publishPower(true)” - when device is off (power is cut), it immediately publishes to
kezia/imu/power:false“publishPower(false)” - when device is on, user can press the “Start/Stop” button and this will
animateStarLEDs(), update the vardrawStateby toggling it between “start” or “stop” then it will trigger pulseDraw() which publish to kezia/imu/draw as “start” or “stop” (viapublishControl()) - When
drawStateis “start” and user clicks the click button, it will be permitted to triggerblinkAllStars()andpulseClick()and publish tokezia/imu/clickas number.
There is no normalization done to the IMU results and we send to MQTT via publishMessage() as:
We also added some haptics for user feedback:

Hardware Product
Some STL files designed by Antonia to resemble the princess-y start part of a magic wand. The star will be able to be connected to compatible stick/wand of choice.


End Goal

The goal of this device is to see how the mouse progresses as we improve it. The metrics to analyze it is by drawing according to the star guide trace in the canvas and then observe the past drawings in the sessions. Hopefully it improves!
Issues
1. Server bandwidth is not enough to accommodate realtime data when deployed online. Local network server seems to be working fine.
Possible solution:
- Sample per longer interval (now Arduino is sending per 200ms
- Move the application to native Desktop app to let it run its server locally for realtime?
2. The device may stop every once in a while, most probably due to WiFi network connection
Possible solution:
- Changing to board that accommodates more stable wifi connection such as ESP32? (might be a bit too late to do for this version)
3. Very confusing for me to calibrate
Possible solution:
- instead of drawing from left -> right or top -> right of screen, we just draw by delta of the movement, which may be annoying at times because it may be too small so we added a sensitivity knob to adjust the scale unit for the delta.
4. Normalization Issues:
- previously we only rely on heading to define the direction and square of gyro & accelerometer to define the magnitude, however, the heading jumps at ~45 deg to >100deg
- then we just go back to our original attempt to just use the raw 6-axis. Suprisingly, it seems to be working a bit better, at least no drifting, but sometimes it produces the wrong direction. I'm actually confused becasue I didn't even normalize it and this seems to be producing more meaningful result on the drawing.
let sensitivity = data.sensitivity; // range: 0-10
const moveX = Math.abs(data.gz) < DEAD_ZONE ? 0 : -data.gz * sensitivity; // DEAD_ZONE is threshold
const moveY = Math.abs(data.gx) < DEAD_ZONE ? 0 : -data.gx * sensitivity;
targetX = Math.max(0, Math.min(targetX + moveX, screenW - 1));
targetY = Math.max(0, Math.min(targetY + moveY, screenH - 1));
Spring Show
For the Spring Show, we'd like to showcase this magic wand as a 'product' with the main function is to control the cursor. To showcase its feature in a playful way, we will create a beat game-like environment so that user can stress test the product.
Elizabeth Kezia Widjaja © 2026 🙂