The SONYC Playground is a two-way data visualization project that presents NYC sound data through both a web-based interface and a physical tabletop game. Using geo-tagged audio recordings, users can explore noise patterns digitally or navigate a projected map of Washington Square Park with tracked pawns (featuring familiar NYC creatures: squirrel and pigeon!), triggering sounds and accumulating noise exposure (dB).
By bridging data visualization and embodied gameplay, the project makes urban noise pollution more tangible and engaging.
Abstract
During 2019 and 2020, the SONYC team worked on recording data regarding noise pollution in three NYC boroughs (Manhattan, Brooklyn, and Queens). The data they collected was to be used for machine learning purposes, sorted with guidance from the NYC Department of Environmental Protection, and used to monitor noise levels in urban environments. (”Noise”, n.d.) According to NYC Health, nearly one in six adults reports ringing in their ears or hearing loss. Noise pollution is a huge side effect of living in “the city that never sleeps,” with huge crowds, traffic, loud subway stations, and events going on practically every day at every hour. According to Transportation Alternatives (”NYC is Loud”, 2025), noise pollution can lead to significant health issues outside of hearing loss, including stress, hypertension, strokes, and even death. Many people who live in the city get used to these “ambient” sounds, but over time, they can greatly affect physical and mental health.
NYU SONYC Playground is an interactive project that gamifies noise pollution by having players compete in a board game where the player affected the least by noise pollution wins. The project’s use of gameplay allows players to interact with the dataset in a digestible and engaging way, while also pushing them to think critically about the prevalence of noise pollution in their everyday lives. By having users play against each other to walk around Washington Square Park and avoid being hit by noise pollution, we were able to create a unique way of thinking about noise and our physical environment.
Ideation/Planning
In the initial phase of picking a topic for this project, we wanted to explore several datasets: Zip code level Covid-19 rate data, Construction costs of urban rail projects, Comprehensive Air Quality, and SONYC Urban tagging. During the discussion, we talked about how our interests would play into the project, the implications of public health present in many of the datasets, and how our skills could mesh with creating this project. Ultimately, we ended up picking the SONYC Urban Sound Tagging dataset, solely, due to its use of audio and its importance in a severely impactful topic that often is not recognized.
After picking the dataset, we ideated some ways to visualize the data, with most of them being interactive. Ultimately, we combined some of our ideas, leading to a board game, where players would be able to travel around Washington Square Park (one of the areas captured in the dataset) and understand how noise pollution is prevalent in areas New Yorkers visit commonly. During this phase, we developed possible rules for the game and divided our work into two sections: data review and game development
Data Review
In order to begin the project, we had to understand the dataset and audio we were working with. The team on this project developed 18,000 audio recordings throughout Brooklyn, Manhattan, and Queens. Each of the audio files is tagged with important information, including the time and date it was collected, which sounds are present, and the coordinates of where the sounds were recorded. These three pieces of information were essential for completing our project, as we wanted to create this board game using accurate geographical information and time.
Firstly, we decided to shorten the dataset that would be accessible for the project. The audio files within the dataset are organized for machine learning in three categories: test, validation, and train, so instead of utilizing all of the files, we selected the test files to use as our portion for project usage. From there, we took only the validated data and looked at only the ones in the geographical range around Washington Square Park, shortening our dataset to around 3,300 files.
In order to find specific sounds within the audio file, we filtered the annotations.csv sheet included in the dataset by the sounds that are present within the files. Since each dataset has a value of 1 when a sound is present, the filter searches for all of the files with a “1” in the original sheet. Additionally, some sounds were marked with “far”, “near”, or “not sure.” Those sounds were categorized as 1 (far and near) or 0 (not sure).
Additionally, we developed a Python script that would iterate over the dataset, convert the ISO calendar format in the dataset CSV file to MMDDYYYY, that’s usable across programming languages, and reformat the data into a JSON object.
Game Development
> The Making
The interface of the game was built to share key points of the audio data that we used in the project: the time it was collected and its coordinates. Essentially, players would be able to change the time of day, which would change the audio files present on the board (for example: if the players chose to play on June 6th, 2020, only the audio files for that day would be accessible on their respective coordinates. If they choose June 7th in the same year, they would not be able to hear the June 6th audio files but only the June 7th files on their respective coordinates). When a player moves to a space, it would either be silent (meaning there is no audio file associated with that coordinate), or it would trigger an audio file (meaning the player stepped on a coordinate that is attached to a file). To make the game even more interactive, we decided to take this board game off the screen and into the physical world using web technology, cameras, and projection mapping.
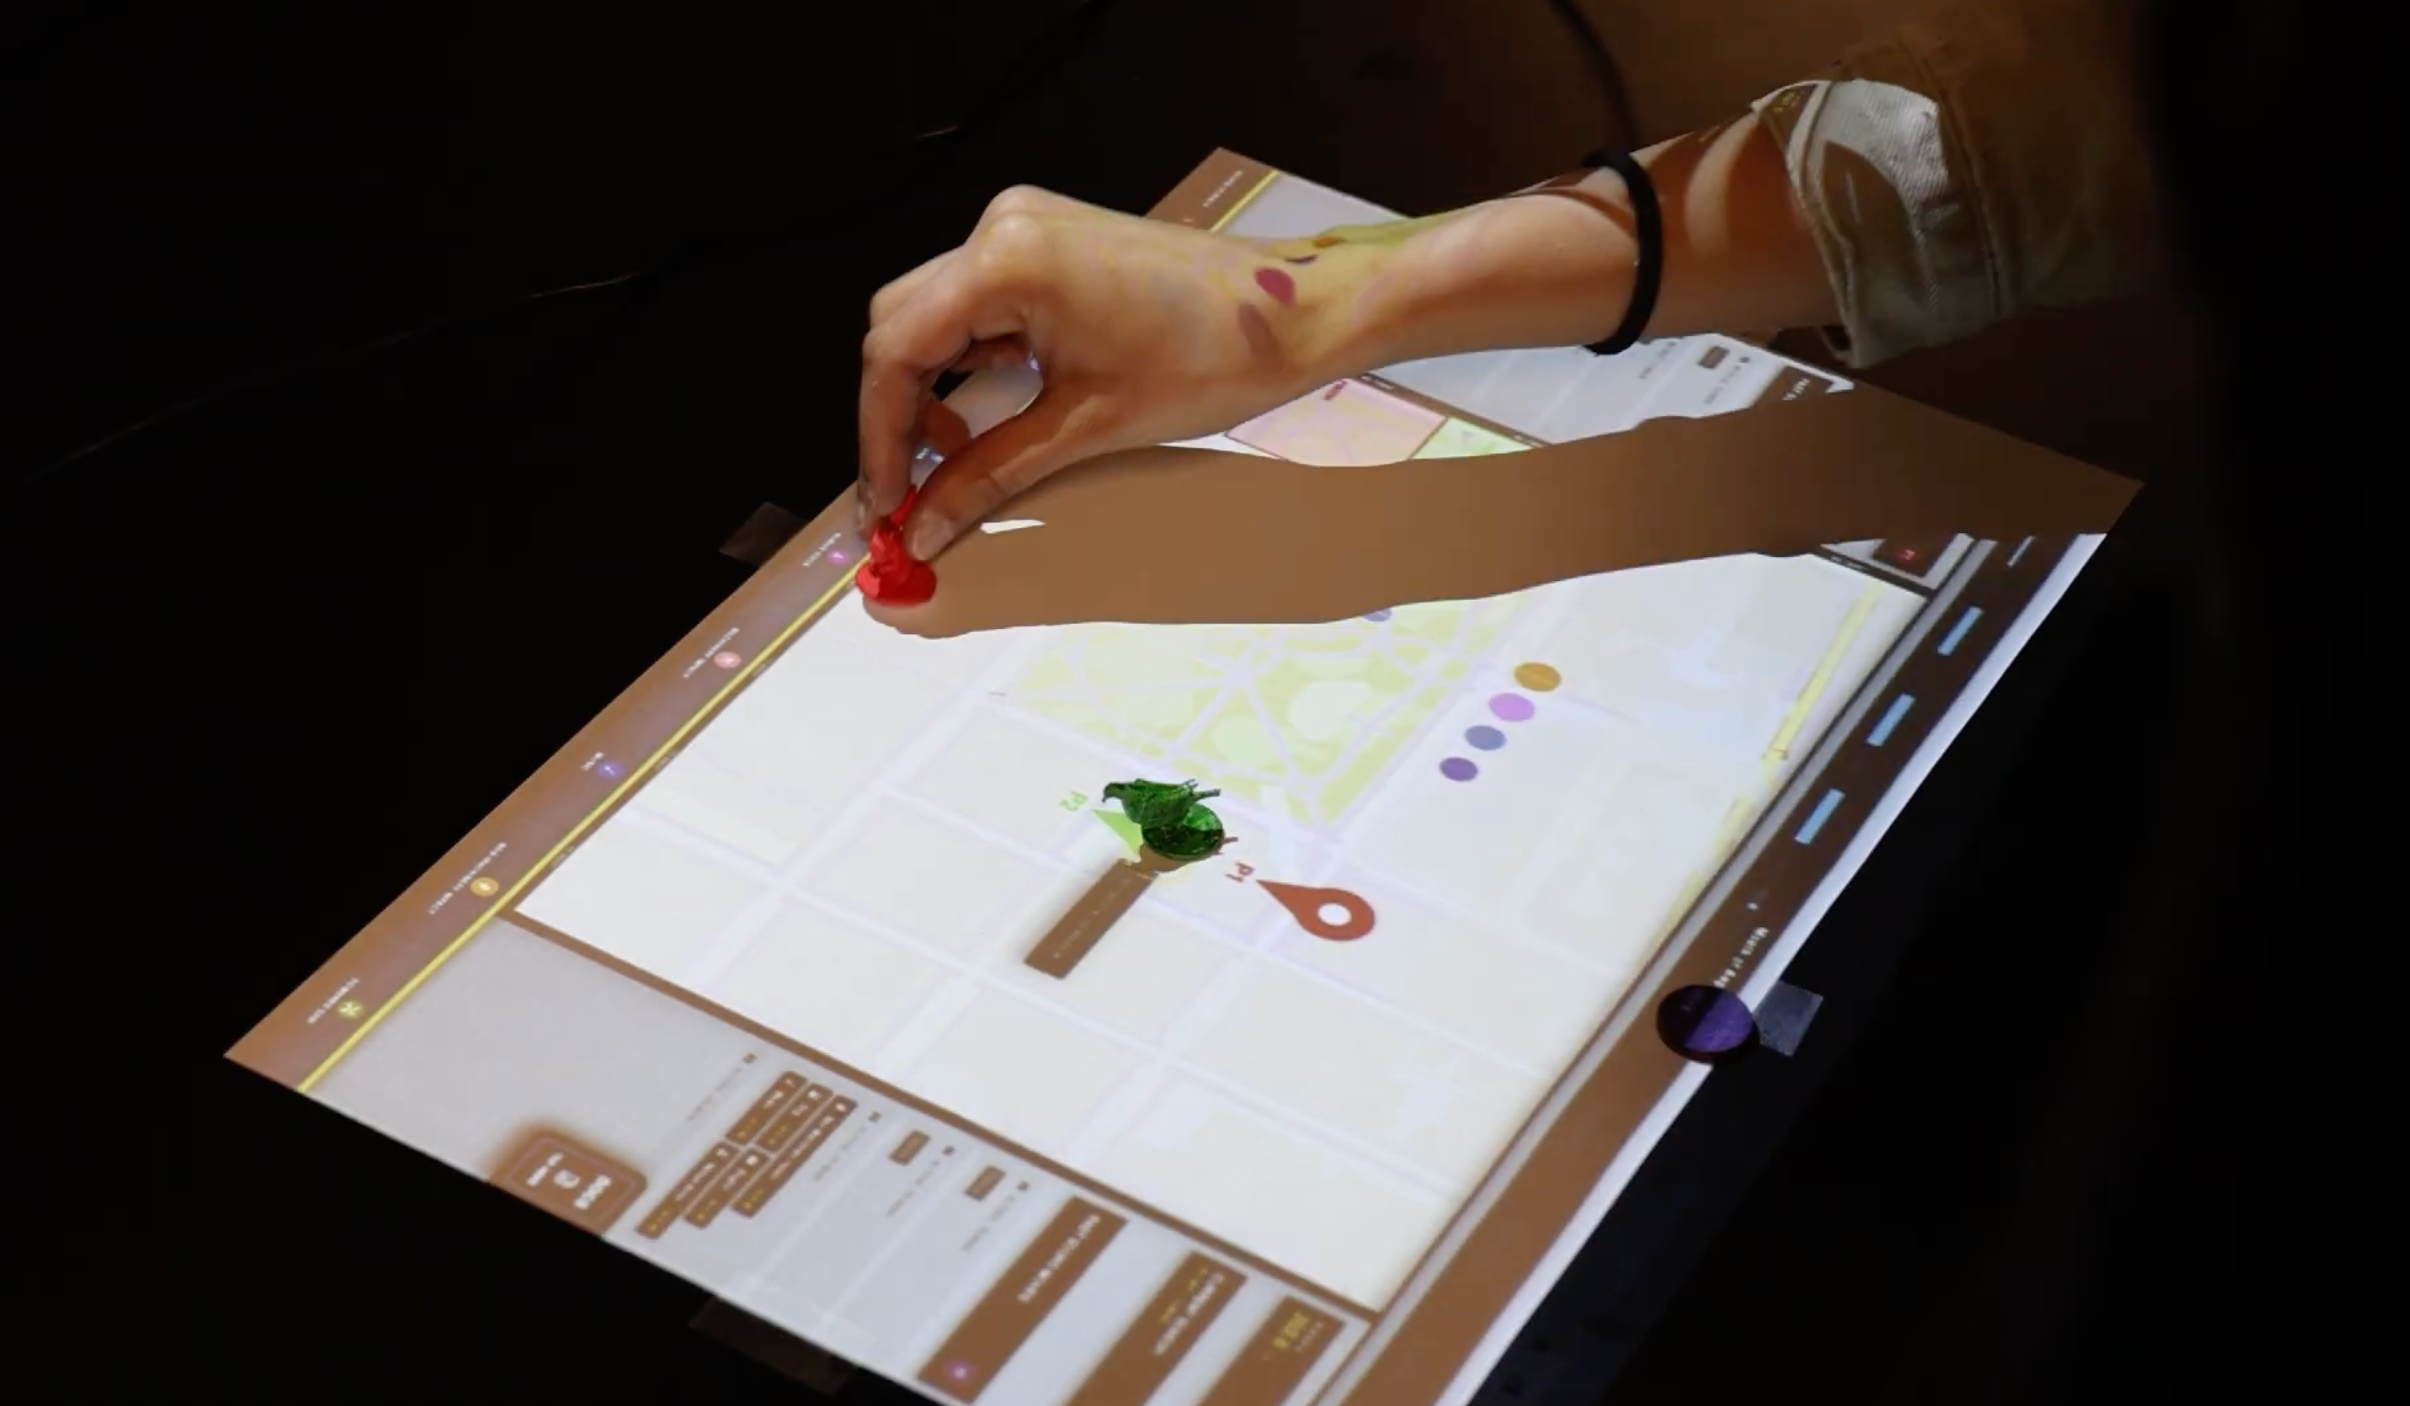
For the gameplay setup, installation includes a webcam to be set perpendicular from the top, a solid color surface fixed on a table, a projector, and a running computer that is connected to the webcam and the projector.
The color-based tracking algorithm is employed to track pawns with the colors that users have defined on menu. By default, it will be red for player 1, green for player 2, and purple for the slider. Pawns must rest for at least 2 seconds for the system to register it as a solid movement, in order to limit movement noises.
The menu also provides an option to do projection mapping by toggling the “Projection Edit” to see where the grid is being projected on the game surface.
How to use
This project features two distinct modes tailored for different user experiences:
> View Mode (Accessibility Focus)
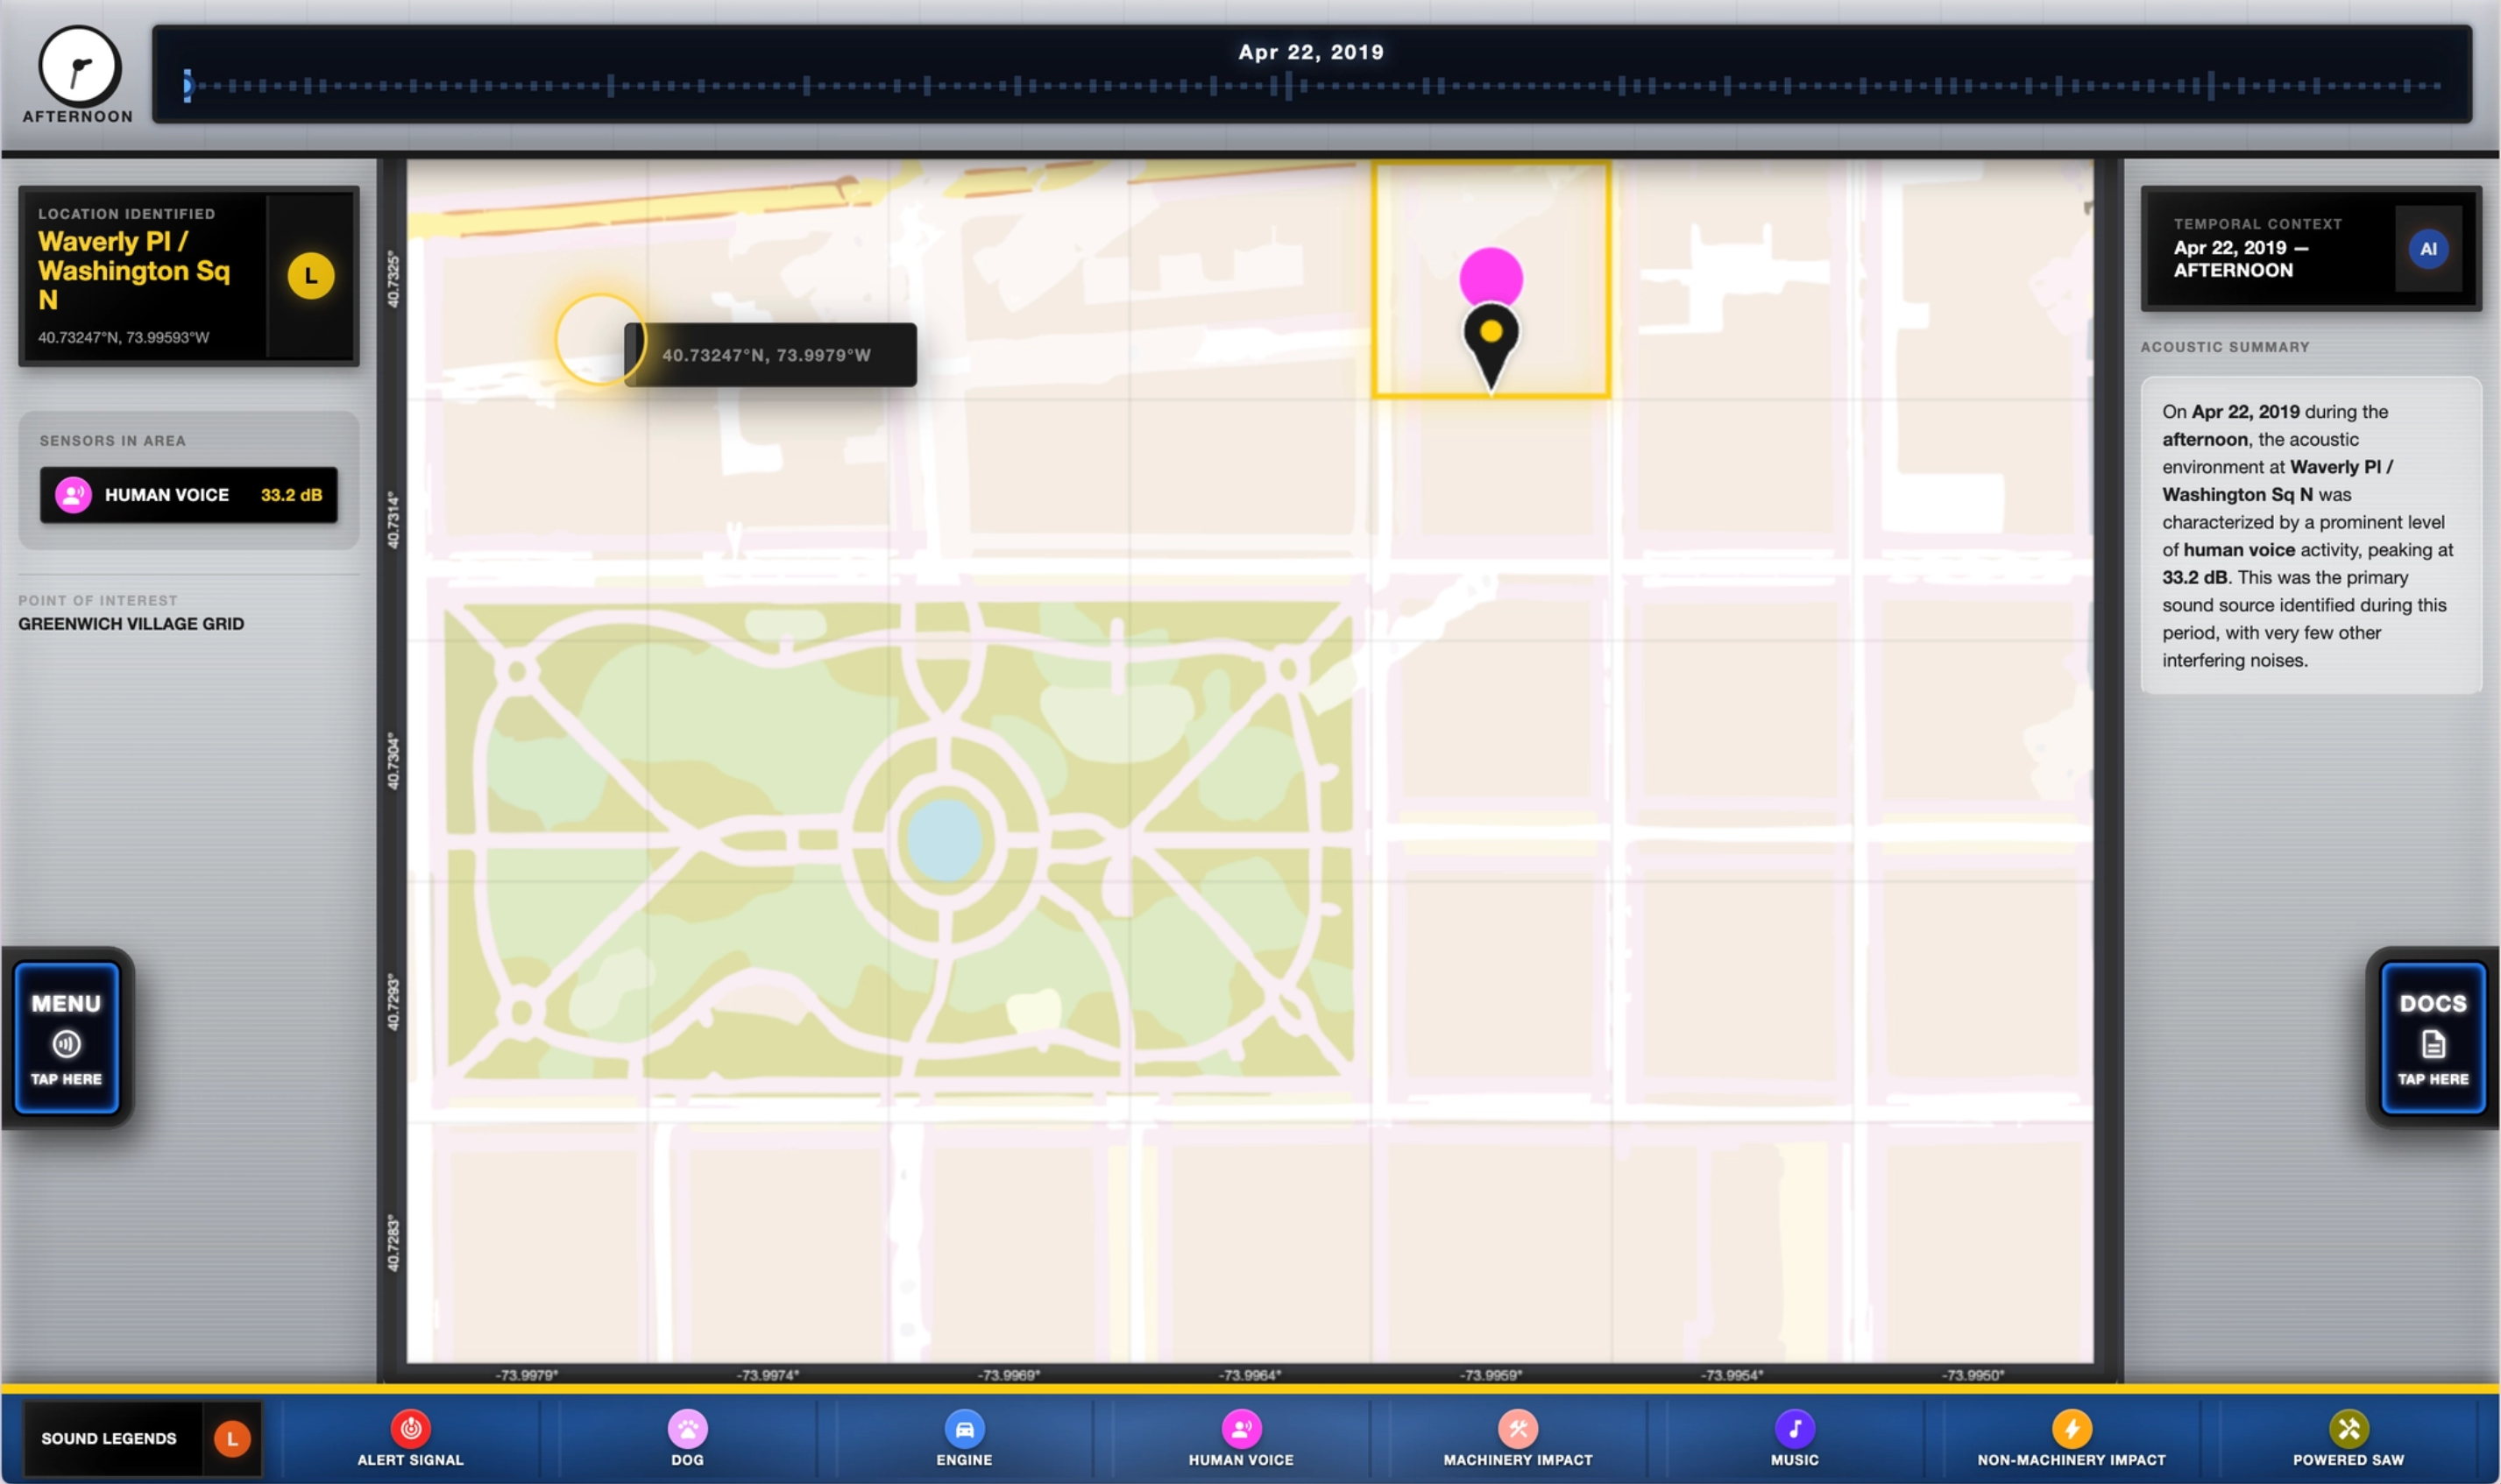
Designed for data exploration. Users can click anywhere on the map grid to analyze acoustic data. The left column shows the identified location and detected sounds, while the right column provides an AI-generated summary of the area's acoustic environment.
The user can navigate around the grid within the map. The location of the grid and the sounds detected in that grid will be displayed on the left panel. On the right panel, the user can read a summarized description of the sound that is present on the particular date and time that is selected.
>Game Mode
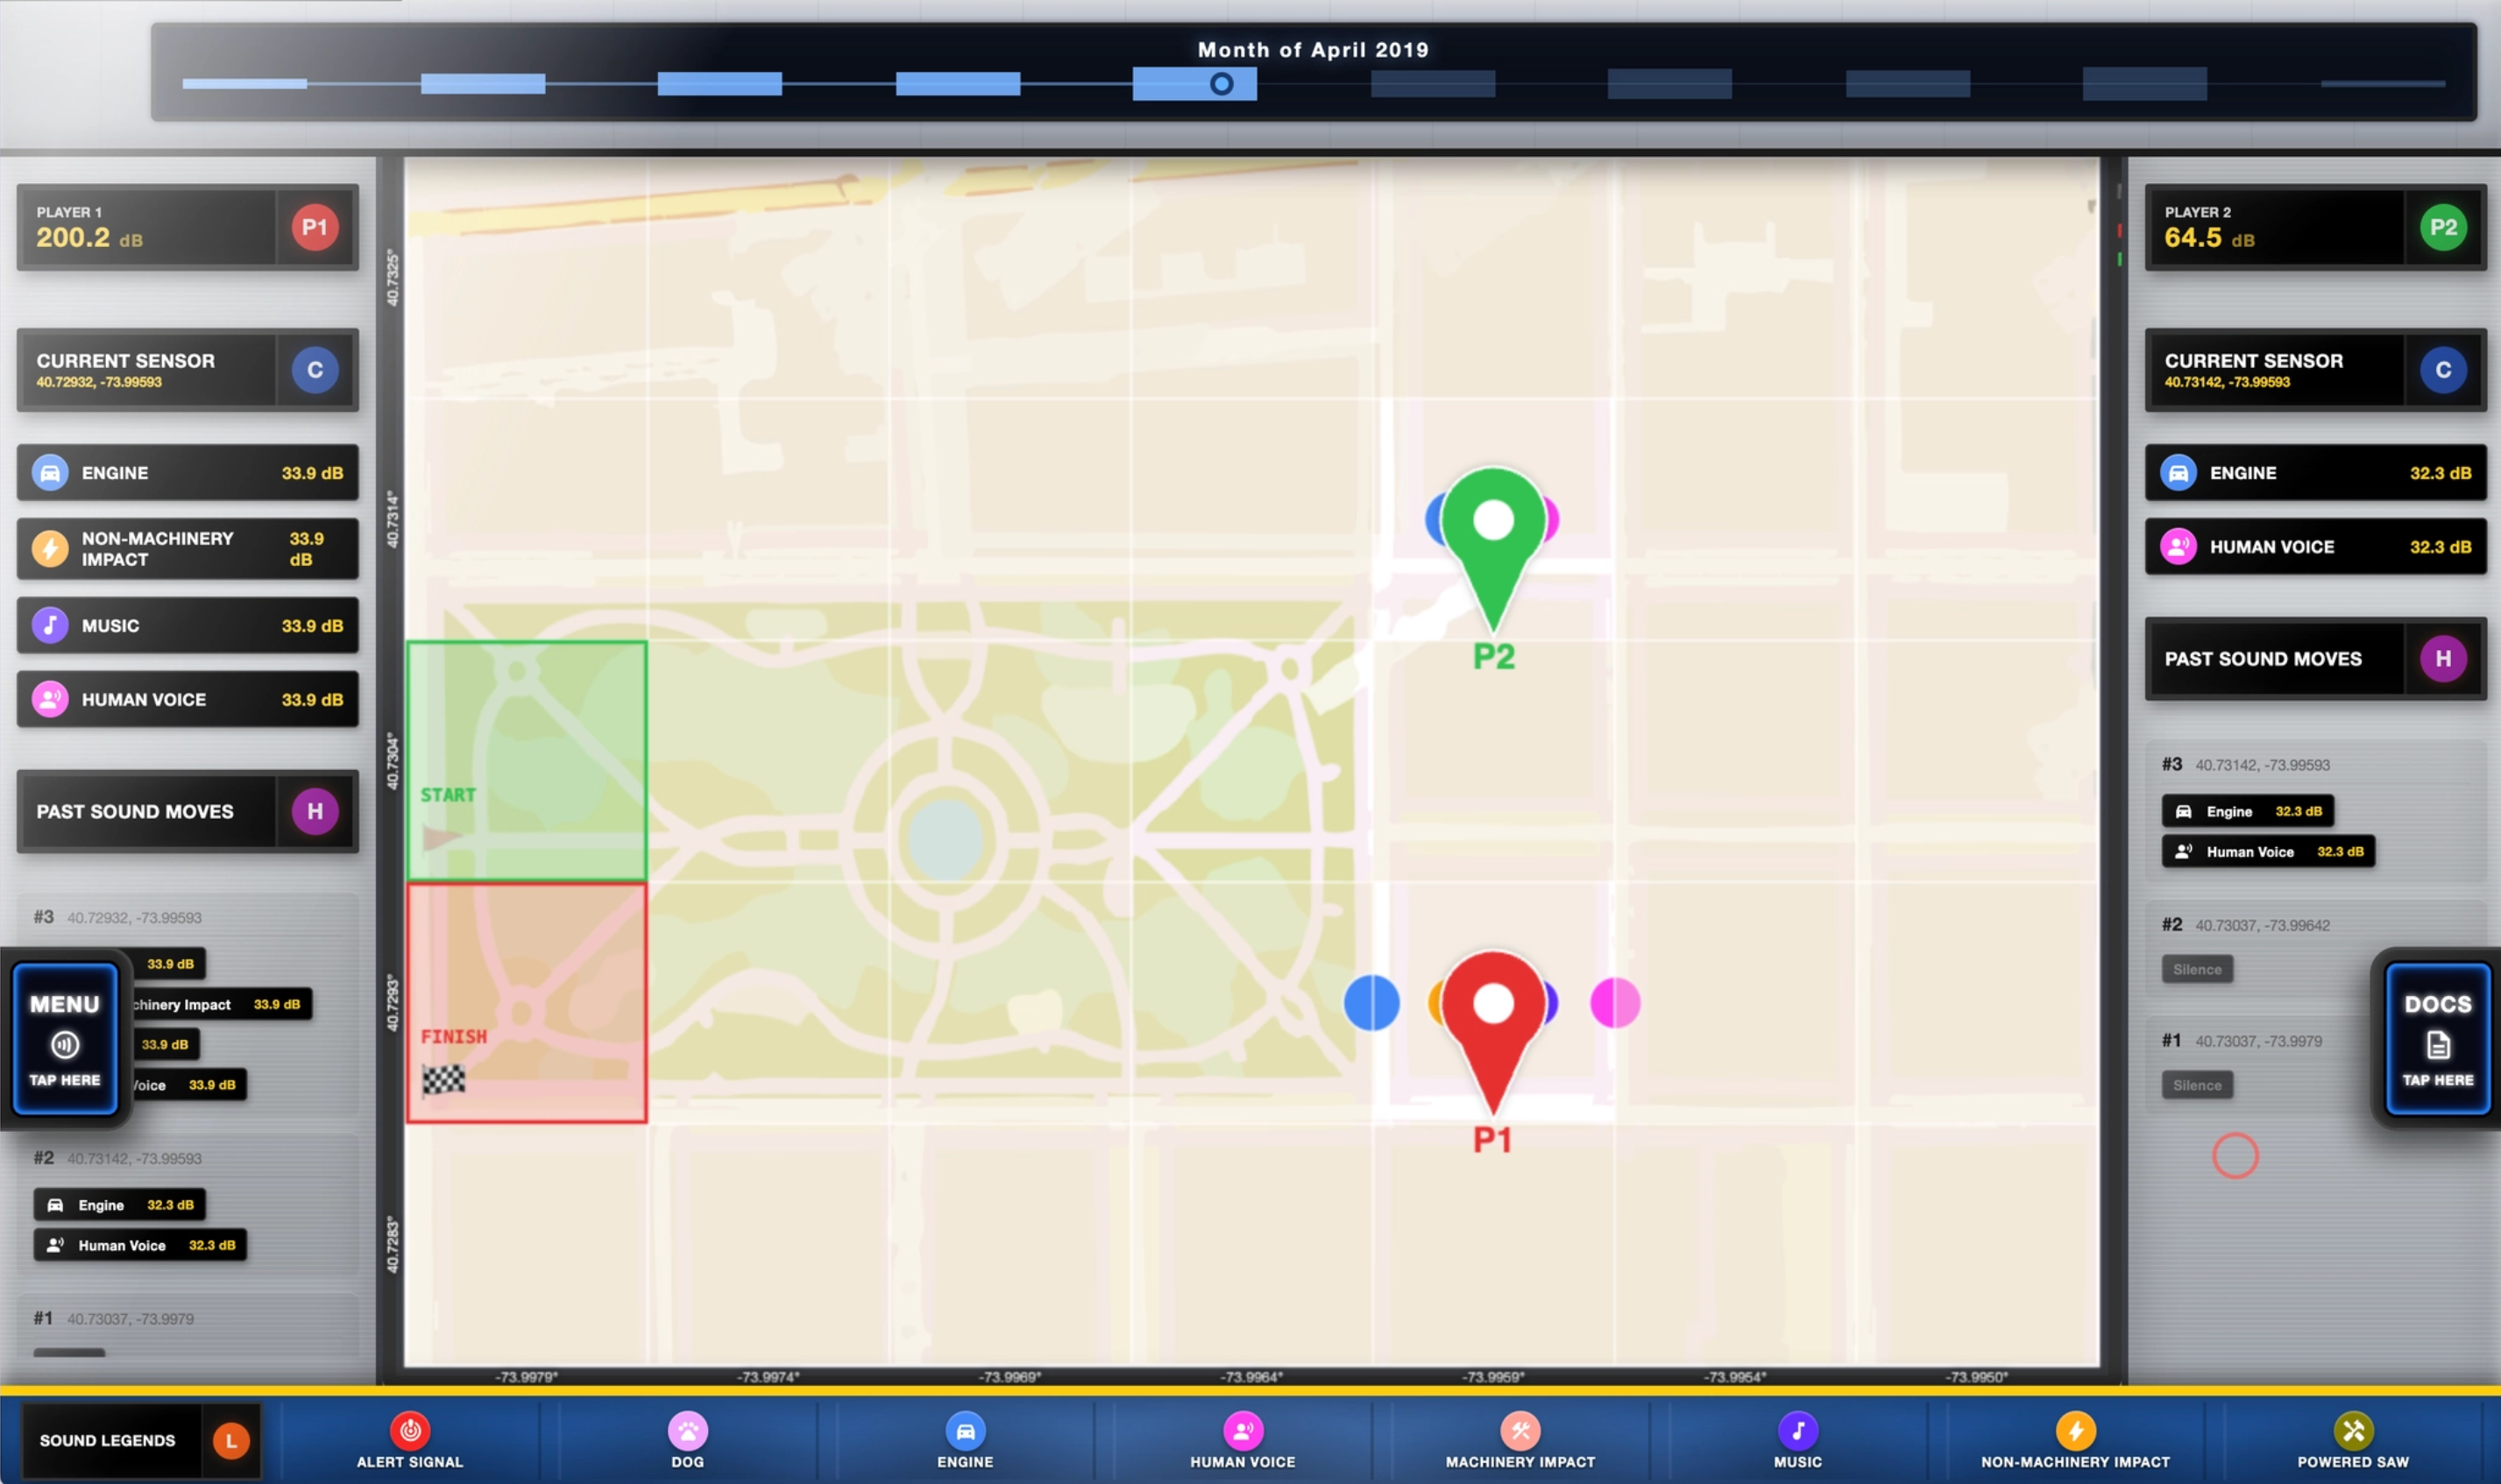
An interactive experience where users navigate the grid using pawns. It tracks accumulated noise exposure (dB), shows current sounds at your position, and maintains a History of Moves to look back at your journey.
User can view their game stats on the left or right panel.
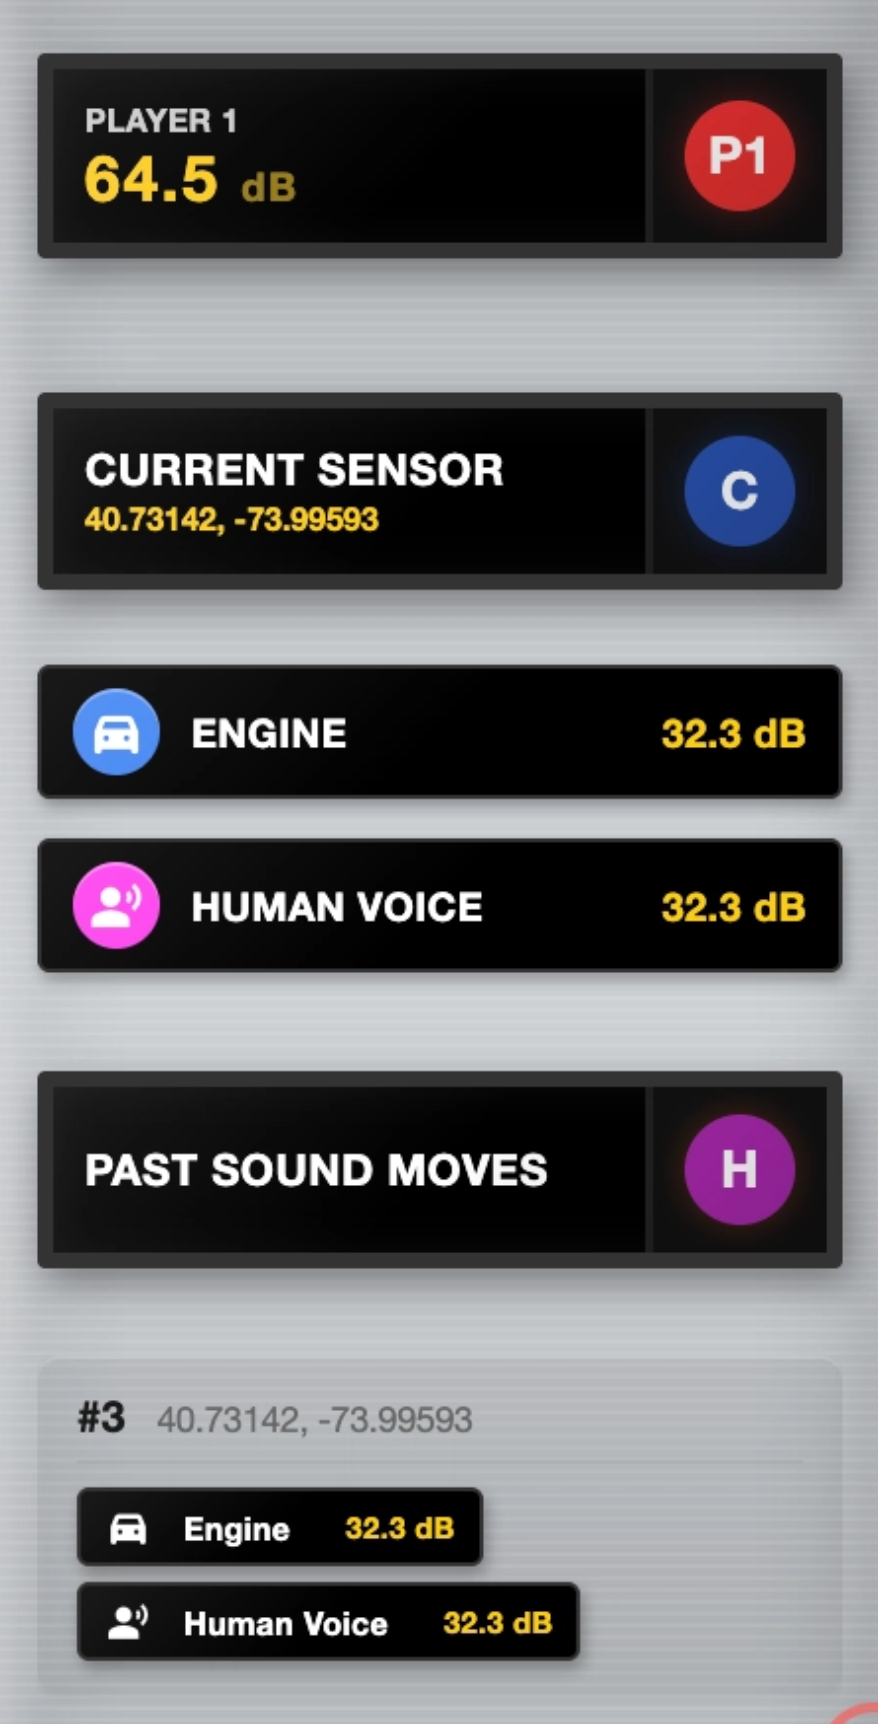
It shows their noise penalty score, the current sounds that are being detected, and their past moves. For example, Player 1 receives 64.5 dB of penalty because they stepped on a grid that has “Engine” and “Human Voice” sounds present on it.
The user can toggle between the “Game” and “View” by switching the “Display Mode” in the menu.
> Temporal Navigation
Navigate the dataset's history using the interactive timeline and clock:
- Timeline Slider: Specify historical dates. The bar graph indicates periods where sounds are most prominent. Setting a date updates the map to reflect sounds at that specific moment.
- Time Clock: Cycle through periods (Morning, Noon, etc.) to see how noise distributions shift throughout the day.
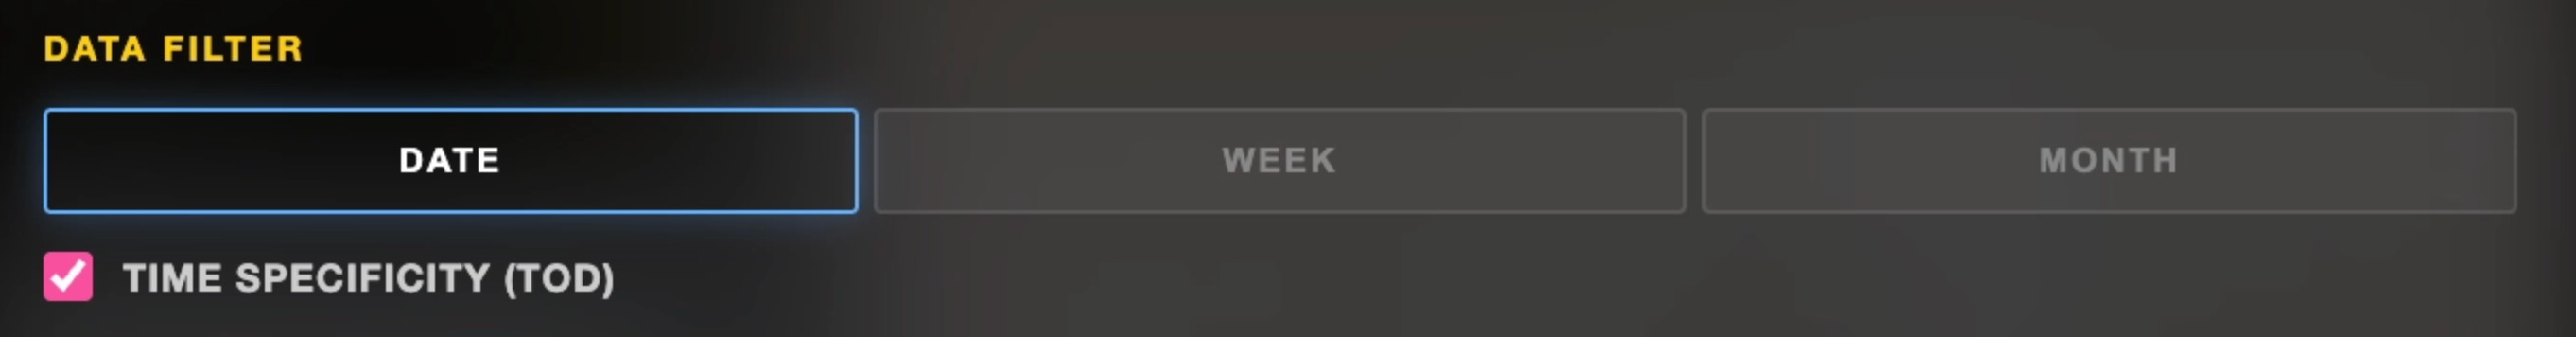
Users may also modify whether they’d like to aggregate the data visualization based on date, week, or month, and whether to include time specificity. For the “game” mode, the configuration is set by default to “Month” and “Time Specificity” is unchecked. The user can do this by going to the “Data Filter” in the menu.
> Sounds Legend & Indicators
Each sound type is represented by a unique color-coded MTA bullet. When a sound is detected at a location, it is marked with a pulsing indicator in the corresponding color that can be referred back to the legends.
● Alert Signal
● Dog
● Engine
● Human Voice
● Machinery Impact
● Music
● Non-Machinery Impact
● Powered Saw

The Sound Legend bar at the bottom allows you to toggle specifically which sounds you want to focus on. Toggling a legend item will update the timeline view to highlight periods where that specific sound is prominent.
> Onboarding / Game Walkthrough
An onboarding walkthrough is provided to tutor first-time users to navigate on the website.
The Game Play
1. Core Objective Two players must navigate from the designated Start Zone (Green) to the Finish Zone (Red). The winner is the participant who concludes the game with the lowest cumulative noise penalty, measured in decibels (dB).
2. Game Setup & Environment • The Grid: The field of play is a 7x5 coordinate matrix (35 cells total). • Starting Position: All players must put their pawns on the Green Start cell in order to commence the game. • Initial Scoring: Each player starts with a base noise penalty of 0.0 dB.
3. Movement & Mechanics • Turn-Based Navigation: Players are free to move anywhere within the grid. • Data Revelation: Noise data is "blind" until a player occupies a cell. Upon landing, the sensor data for that coordinate is revealed, and its dB value is added to the player’s cumulative score. • The Minimum Threshold: To simulate a realistic commute, players must complete a minimum of 10 moves before they are eligible to enter the Finish Zone.
4. Conclusion of Play • Finalization: The match remains active until both players have landed on the Red Finish cell. • Victory Condition: Upon both players finishing, the player with the lowest total dBs accumulation is declared the winner.
5. On the User Interface:
Noise Penalty (dB): Tracks the total cumulative noise penalty.
Current Sensor: Displays the noise type (e.g., Engine, Human Voice) of the current cell.
Past Sound Moves: A log of previously visited cells to assist in pathfinding strategy.
Status Bar: Displays active noise interference types currently impacting the map
Aesthetic Choices
The website style is inspired by MTA color palette to emphasize on the NYC specific theme.
The following materials were produced while running a prototype of the game to test user flow and understanding.
To help make the experience even more engaging, we 3D printed pawns for the players to use as physical pieces to move across the projected board. The piece takes inspiration from common New York City animals, a pigeon and a squirrel.
Works Cited
Noise. (n.d.). Retrieved from https://www.nyc.gov/site/doh/health/health-topics/noise.page
User, G. (2025). New York City is loud. it doesn’t have to be this way. Retrieved from https://transalt.org/blog/new-york-city-is-loud-it-doesnt-have-to-be-this-way
Elizabeth Kezia Widjaja © 2026 🙂